2021 is turning out to be another very good year for stocks.
After another strong week, the S&P 500 (SPY) closed at a new all-time high. The index is now up 13% on the year.
- The tech heavy NASDAQ 100 (QQQ) is lagging the broader market, up 8% on the year.
- The Vanguard Global stock market (VT) is up 12% on the year.
- Emerging Markets (EEM) is up 5% on the year.
The recent string of gains has been driven by two few key factors.
Q1 earnings have been excellent: First-quarter earnings have been excellent, handily exceeding lofty expectations. Here are some details from Zacks Investment Research.
For the 425 S&P 500 members that have reported Q1 results already, total earnings and revenues are up +47% and +10.3%, respectively. The proportion of these 425 index members beating EPS and revenue estimates is a very high 85.9% and 76.7%, respectively.
These results are impressive on their own – but even more impressive when considering certain sectors of the economy are still being restricted by COVID.
Just as important as Q1 results, forward guidance was also excellent. CEO’s are optimistic about business for the rest of the year as the global economy continues to rebound out of COVID.
Central banks pumping trillions into the economy: In response to COVID, global central banks and governments have been pumping trillions in cash into the global economy. For example, in the last 14 months, the U.S. federal reserve has pumped about $3.5 trillion into the U.S. economy. This money is finding its way into the stock market and giving global stocks a big boost.
What Should We Expect Moving Forward
I remain optimistic on stocks – however I am expecting to see increased volatility in the stock market for the next 3-4 months because of two reasons.
#1 October through April are historically the best seven months of the year for the stock market. You can see that in the table below.
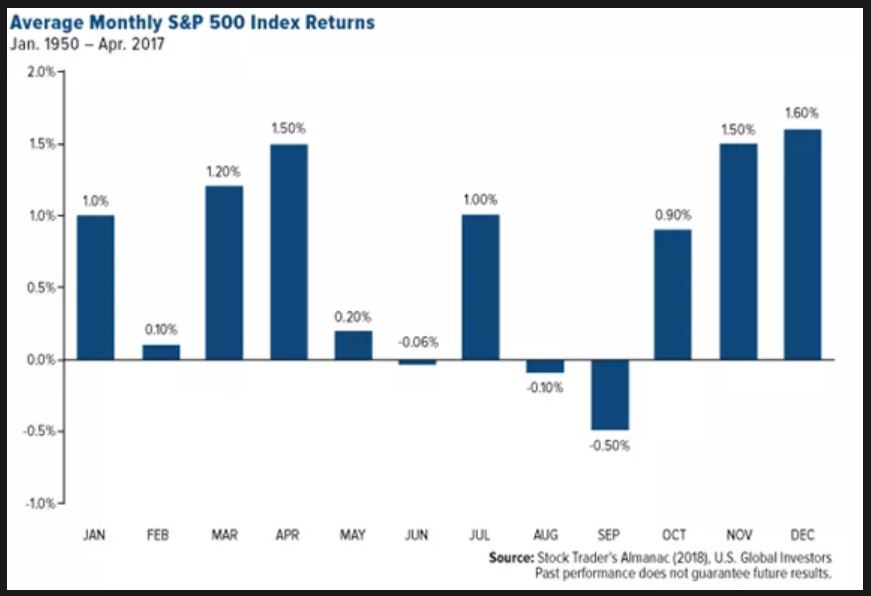 *Chart from Investopedia and Traders Almanac.
Now – stocks are entering a period of the year that is typically more volatile with lower returns.
#2 After strong gains in 2020 and a strong start to 2021, U.S. stocks are looking overbought in the short run.
Below is a 5-year chart on the S&P 500 – the index is up 105% in that time. Shares are trading sharply above the 50-day moving average (dark blue line) and the 200-day moving average (light blue line). What you can see from this chart is that the best time to buy the S&P 500 in the last five years is when the index was down sharply, and hitting the 50-day or 200-day moving average.
The relative strength index (RSI) below the chart – a technical indicator that signals when a stock is overbought or oversold – is signaling that stocks are at an extreme level of being over bought right now. Every time the RSI has been at this level for the last five years the S&P 500 has seen a pullback. Take a look at the 5-year chart below.
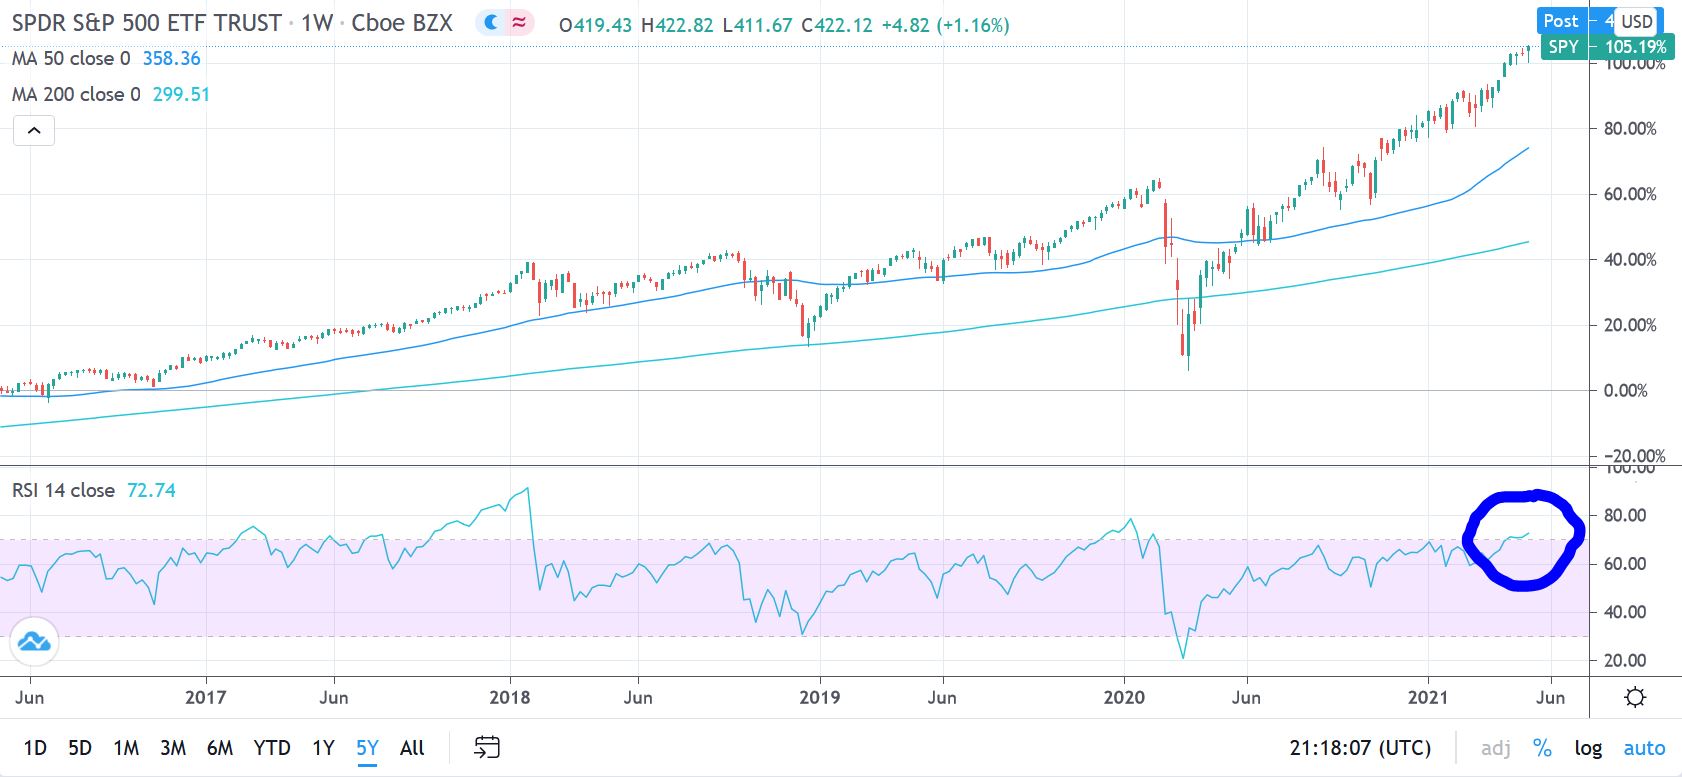 *chart from tradingview.com
This chart above is telling me that this is the time to be patient when deploying more cash into the stock market.
Here is the Plans Moving Forward
I am expecting more gains from the stock market this year but I am expecting to see increased volatility in the next few months.
I expect that volatility to create some really good opportunities.
My plan is to use weakness in stocks as a buying opportunity. If stocks are down I will use that as an opportunity to buy more share.
Disclaimer: This report is for entertainment purposes only. Every investor should consult with an investment advisor before making investment decisions. The Vodicka Group, Inc. is not a broker/dealer. We do not receive compensation for mentioning stocks. At various times, the clients, publishers and employees of Vodicka Group, Inc., may buy or sell the securities discussed for purposes of investment or trading.


