US Stocks had a tough week – their worst of the year – with the S&P 500 closing in the red every day of week.
- For the week, the S&P 500 fell 2.2%.
- The tech heavy NASDAQ fell 2.5%.
You can see the S&P 500 ‘turning over’ in this chart below.

What is driving this patch of weakness? I see a few primary drivers.
I see a few factors driving this patch of weakness.
#1 ongoing concerns about US, China trade relations.
#2 a disappointing jobs report.
#3 concerns about slower economic growth in 2019.
#4 short-term profit taking, stocks are up a lot in 2019.
These are all legit concerns. However I do not believe this is the beginning of another big sell off like we saw in the fourth quarter.
I view this as some short-term profit taking after a big rally in the S&P 500 in January and February.
Because there are still plenty of reasons to be optimistic.
Global and US Economies Still Seeing Robust Growth
#1 The global economy won’t grow as quickly as it did in 2018, but it will still grow at a very healthy clip that is a long way from a recession. Here’s a clip from the New York Times.
The Organization for Economic Co-operation and Development said this week that it expects global growth to be 3.3 percent this year, down from the 3.5 percent that it had forecast just four months ago.
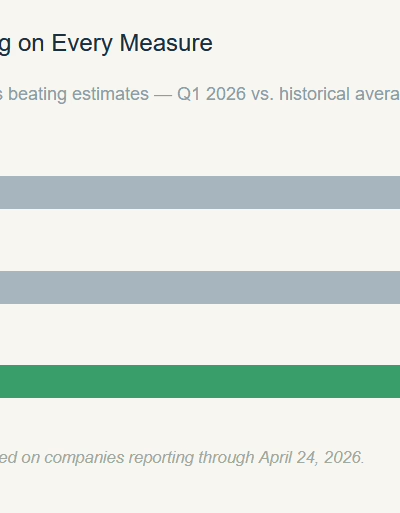
Corporate Sales and Earnings Still Expanding
#2 The S&P 500 saw huge sales and earnings growth in 2018. In 2019 the pace of corporate sales and earnings growth will slow, but both are expected to continue expanding.

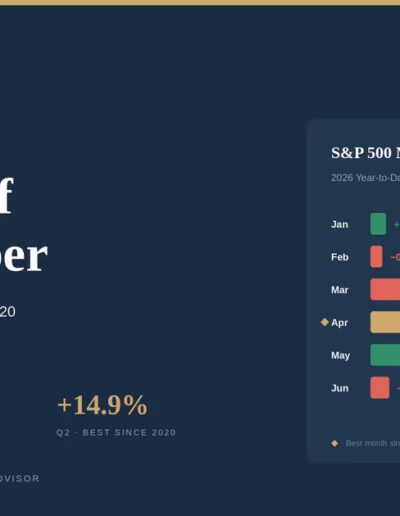
#3 despite the red week US stocks are still having a very good year, with the S&P 500 up around 9%.
What Should We Expect Moving Forward?
I am expecting to see some more weakness and volatility.
But beyond that – I am still optimistic and I am expecting US and global stocks to have a good year.
On the chart, I see some key areas of support on the chart at the 200-day moving average, the red line, and the 50-day moving average, the blue line.
If you look above the chart you can see the relative strength index – a technical indicator that measure when stocks are over bought or over sold.
The relative strength index shows that the S&P 500 was overbought in January and February. Now, even after a small pullback, the relative strength index is resetting and quickly moving back to neutral territory.

The Big Picture
Some short-term profit taking is totally normal after a big rally. In the short run I am expecting to see some more volatility, but I do not think this is the beginning of another big sell off.
- mike@vodickagroup.com
- mikevodicka@gmail.com
Your Investment Partner,